ANALYSIS: PPS Inventory
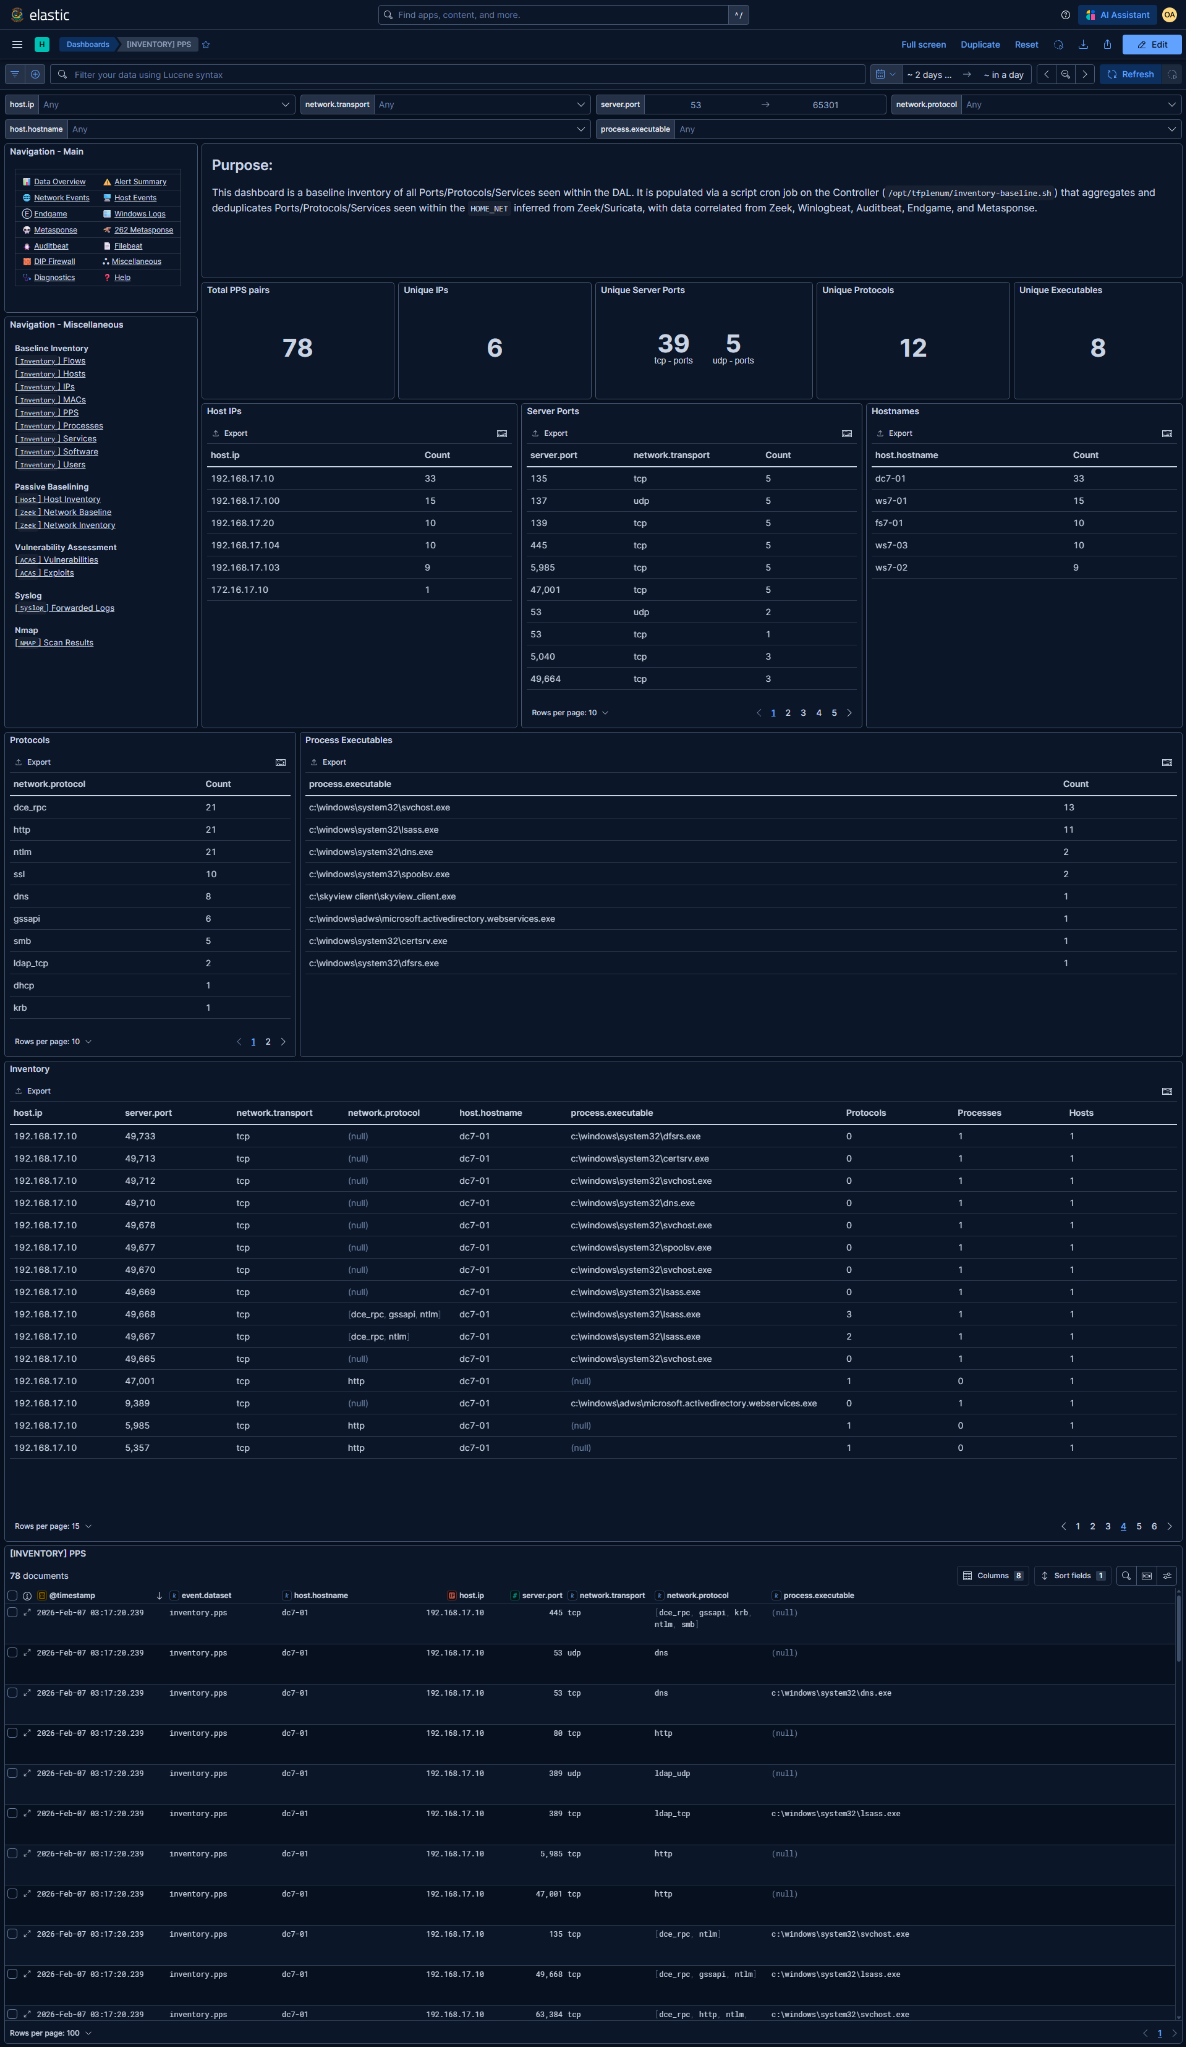
Kibana Dashboard: [INVENTORY] PPS
What is this baseline?
The associated Kibana dashboard represents the baseline inventory of listening ports and associated services observed within the DAL.
- A PPS (Ports / Protocols / Services) entry represents:
- An IP address listening on a port
- Over a given transport (
tcp/udp) - Optionally correlated to:
- An application-layer protocol
- A process executable
- A hostname
- Each row answers:
"Was this IP observed listening on this port/transport within the DAL?"
- This is not a service monitor:
- No uptime or availability tracking
- No guarantee the port is still open
- A single corroborated observation is sufficient to add a PPS entry to the baseline.
- Entries are deduplicated by this tuple:
host.ipserver.portnetwork.transport
- Optional enrichment includes:
network.protocolprocess.executablehost.hostname
@timestampreflects when the listening tuple was last observed and written into the baseline
Data Prerequisites
If any of these are missing or incorrect, the baseline is unreliable.
1. DAL / HOME_NET must be correct
- Derived from Zeek and/or Suricata
HOME_NET - Used to determine which IPs are eligible to be considered "listening"
- Incorrect DAL → missed services or misclassified exposure
2. Required telemetry sources (at least one)
- Zeek (
conn) - Sysmon (network Event ID
3) - Auditbeat (
socket) - Endgame (network telemetry)
- Nmap (when available)
- Metasponse
Netstat Collector262 - [🔥Volatile Info] Netstat
NOTE: PPS coverage is highly telemetry-dependent.
Environments without host-based telemetry will rely heavily on Zeek/Nmap and may miss local-only listeners.
Basic Analysis Workflow
1. Baseline sanity check
Validate expected exposed surface:
- Known servers expose expected ports
- No obvious high-risk services unexpectedly exposed
- Port distributions match mission topology
- TCP/UDP listeners are understood and justified
Unexpected absences often indicate missing telemetry rather than stealth.
2. Long-tail analysis (primary value)
Focus on rare or unexpected listeners
- High ports with low occurrence
- Services listening on workstations
- Unexpected TCP/UDP listeners
- Listeners with no associated process
Key questions
- Legitimate application or service?
- Temporary admin or maintenance activity?
- Misconfiguration?
- Backdoor or unauthorized service?
Cross-reference with:
- Host inventory
- Process inventory
- Flow inventory (who talks to it)
3. Process and protocol correlation review
Process-bound listeners
- Validate executable path and legitimacy
- Watch for LOLbins hosting unexpected services
Protocol mismatches
httpon non-standard ports- Encrypted protocols where plaintext is expected
- Missing protocol labels where traffic volume exists
Ambiguity here signals investigation priority, not automatic compromise.
4. Export for reporting and diffing
Reporting and documentation requirements are determined by the Mission Element Lead/Crew Lead
Common exports
- Full Inventory table (CSV)
- Listening port list by host
- High-port listener subset
NOTE: These exports represent the declared exposed-service baseline for the mission period.
5. Enable baseline deviation detection rule
Enabling too early guarantees noise - it will alert on ALL new inventory additions after enablement.
Detection rules can be managed in Kibana under Security → Rules
Rule: [262][Inventory] New listening port added to baseline
- Detection logic:
Alert when a new listening port/transport combination within the DAL is added to the baseline inventory
- Only enable after:
- Baseline window is complete
- Expected services are fully observed
- Long-tail PPS review is finished
- Ongoing alert tuning:
- Whitelist known admin or maintenance listeners
- Suppress ephemeral or short-lived services
- Validate whether the port represents new exposure or expected change
This rule is intended to catch:
- Unauthorized services
- Backdoors and bind shells
- Misconfigurations introducing new exposure