STEP 1: Alert Selection
In Kibana, SIEM/Elastic Security alerts can be primarily observed and interacted with by navigating to (Security) Alerts
There are a many of methods of selecting an alert to drill into and triage depending on your goal, most common are:
- False Positive Reduction: Filtering on the most frequent alert to potentially tune out false positives causing noise
- Long Tail Analysis: Filtering on the least frequent alert to potentially uncover malicious activity from anomalies
- High Severity Alert: Drilling into the highest severity alert or alert with the most “interesting” or anomalous description
- Related Investigation: Drilling into alerts that appear to be related to an ongoing investigation
Approaches
False Positive Reduction
When to do this: Typically at the beginning of a mission you will have a large number of alerts - most, if not all, of which will end up being false positives. In any case, the quantity of alerts may be drowning out true positives and hindering you hunt for MCA. To save your team the time of sifting through false positive alerts just to get something worth investigating, you can choose to tackle them head-on in order to implement exceptions and prevent the rules from firing more false positive alerts in the future.
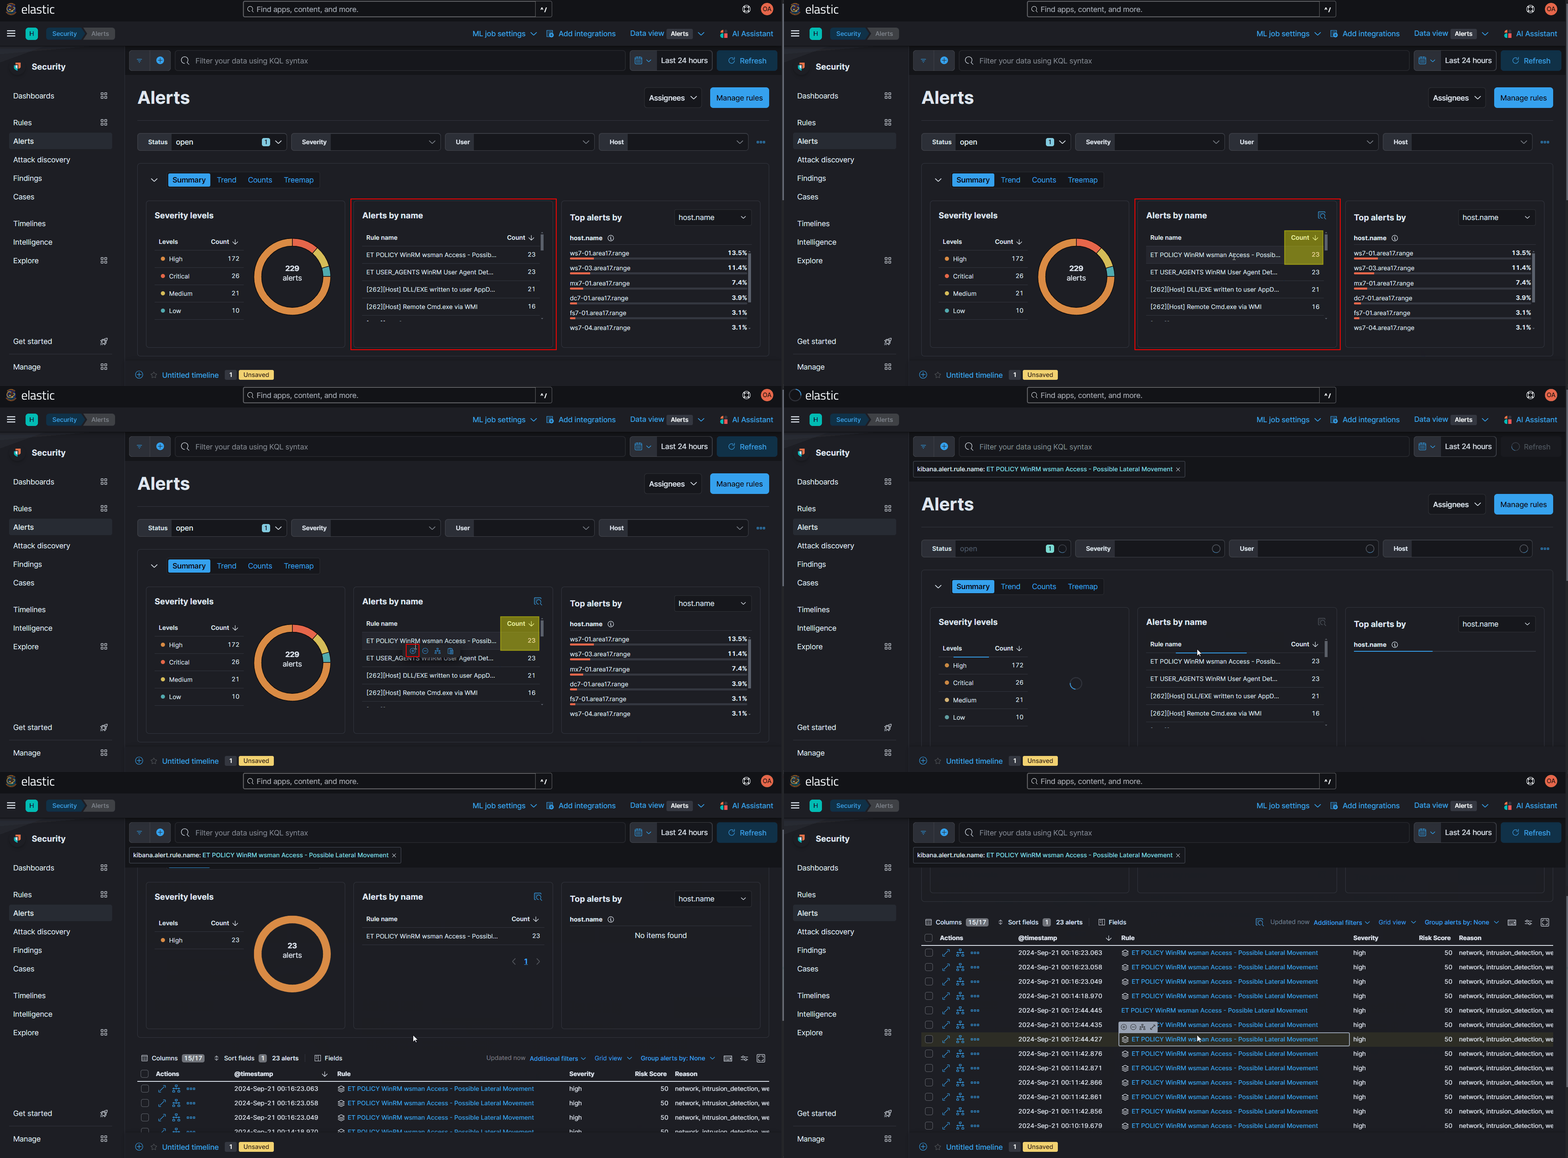
One method of selecting an alert for false positive reduction is by filtering for the noisiest alert:
- Navigate to the Kibana (Security) Alerts console
- Ensure that the Summary tab selected so that you can see the Security levels, Alerts by name, and Top alerts by visualizations
- Ensure that the Alerts by name
Countcolumn is sorted so that the alerts with the highest count is displayed on top - Hover over one of the alerts with the highest counts until the mini-toolbar appears - then click the ⊕ plus sign (
Filter In)NOTE: If there are multiple high count alerts, analyze the Rule name to make an assessment as to which alert to select first
- At the bottom of the page, you will now only see the filtered alerts displayed
Long Tail Analysis
When to do this: "Long Tail Analysis" of alerts is often performed when there is a large quantity of false-positive or low fidelity alerts, so the analyst decides to look into the alerts that happen infrequently or only once. These alerts are often triggered by an anamalous event that is worth investigating.
But be aware that that the age + sampling of log data you are collecting may skew whether the alert is truly anomalous or not. For example, if you have only been collecting logs from a single host for one day, then you may not yet have enough contextual data to confirm if the event was truly anomalous across the domain of hosts - or if the event occurs on that host everyday and is actually normal activity. This is why it is also important to analyze the rule itself.
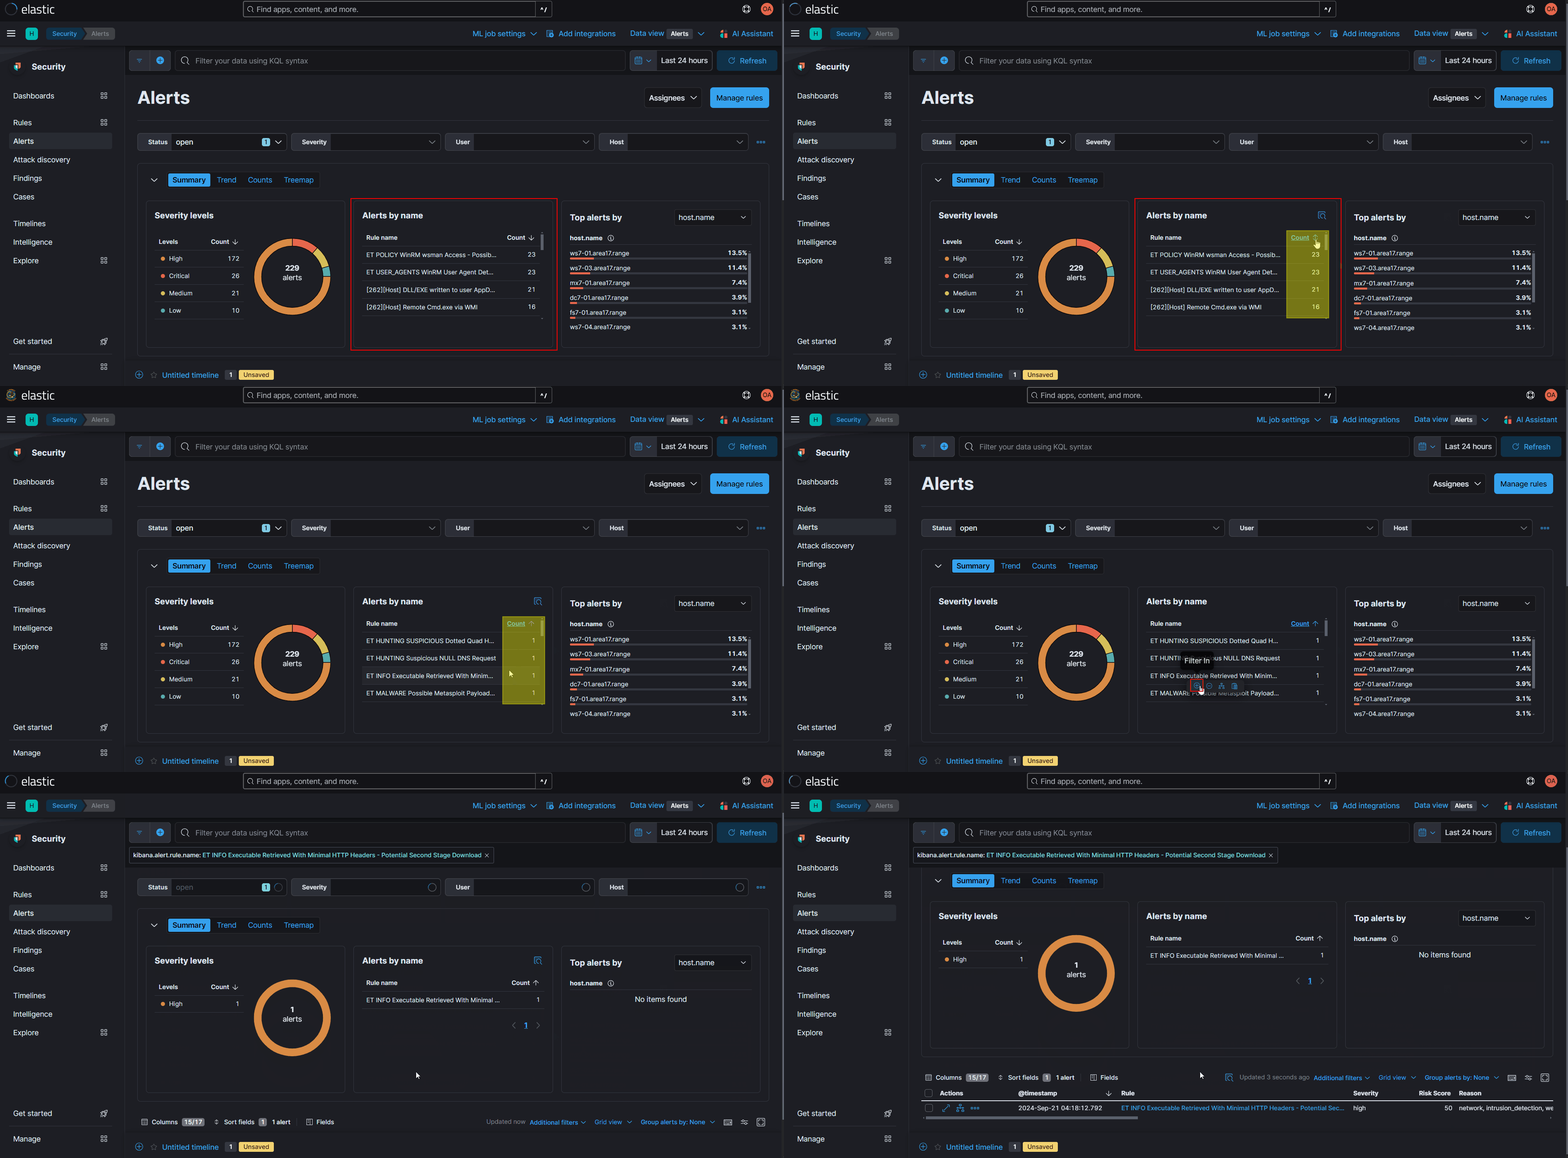
One method of performing "Long Tail Analysis" of alerts is by filtering for the quietest, or least frequent alert:
- Navigate to the Kibana (Security) Alerts console
- Ensure that the Summary tab selected so that you can see the Security levels, Alerts by name, and Top alerts by visualizations
- Toggle the Alerts by name
Countcolumn so that so that the alerts with the lowest count is displayed on top - Hover over one of the alerts with the lowest counts until the mini-toolbar appears - then click the ⊕ plus sign (
Filter In)NOTE: If there are multiple low count alerts, analyze the Rule name to make an assessment as to which alert to select first
- At the bottom of the page, you will now only see the filtered alerts displayed
Related Investigation
When to do this: When you already investigating an event or existing alert/case and are looking for alerts that may be related to your original trailhead. This normally starts with filters or queries to narrow down alerts that are related to a specific user, IP address, or host. The most common fields used to search for related events are:
source.ip/destination.ip(userelated.ipto search for an IP in any IP field)host.name(userelated.hostto search for a hostname in any hostname field)user.name(userelated.userto search for a username in any username field)file.name(userelated.file.nameto search for a filename in any filename field)
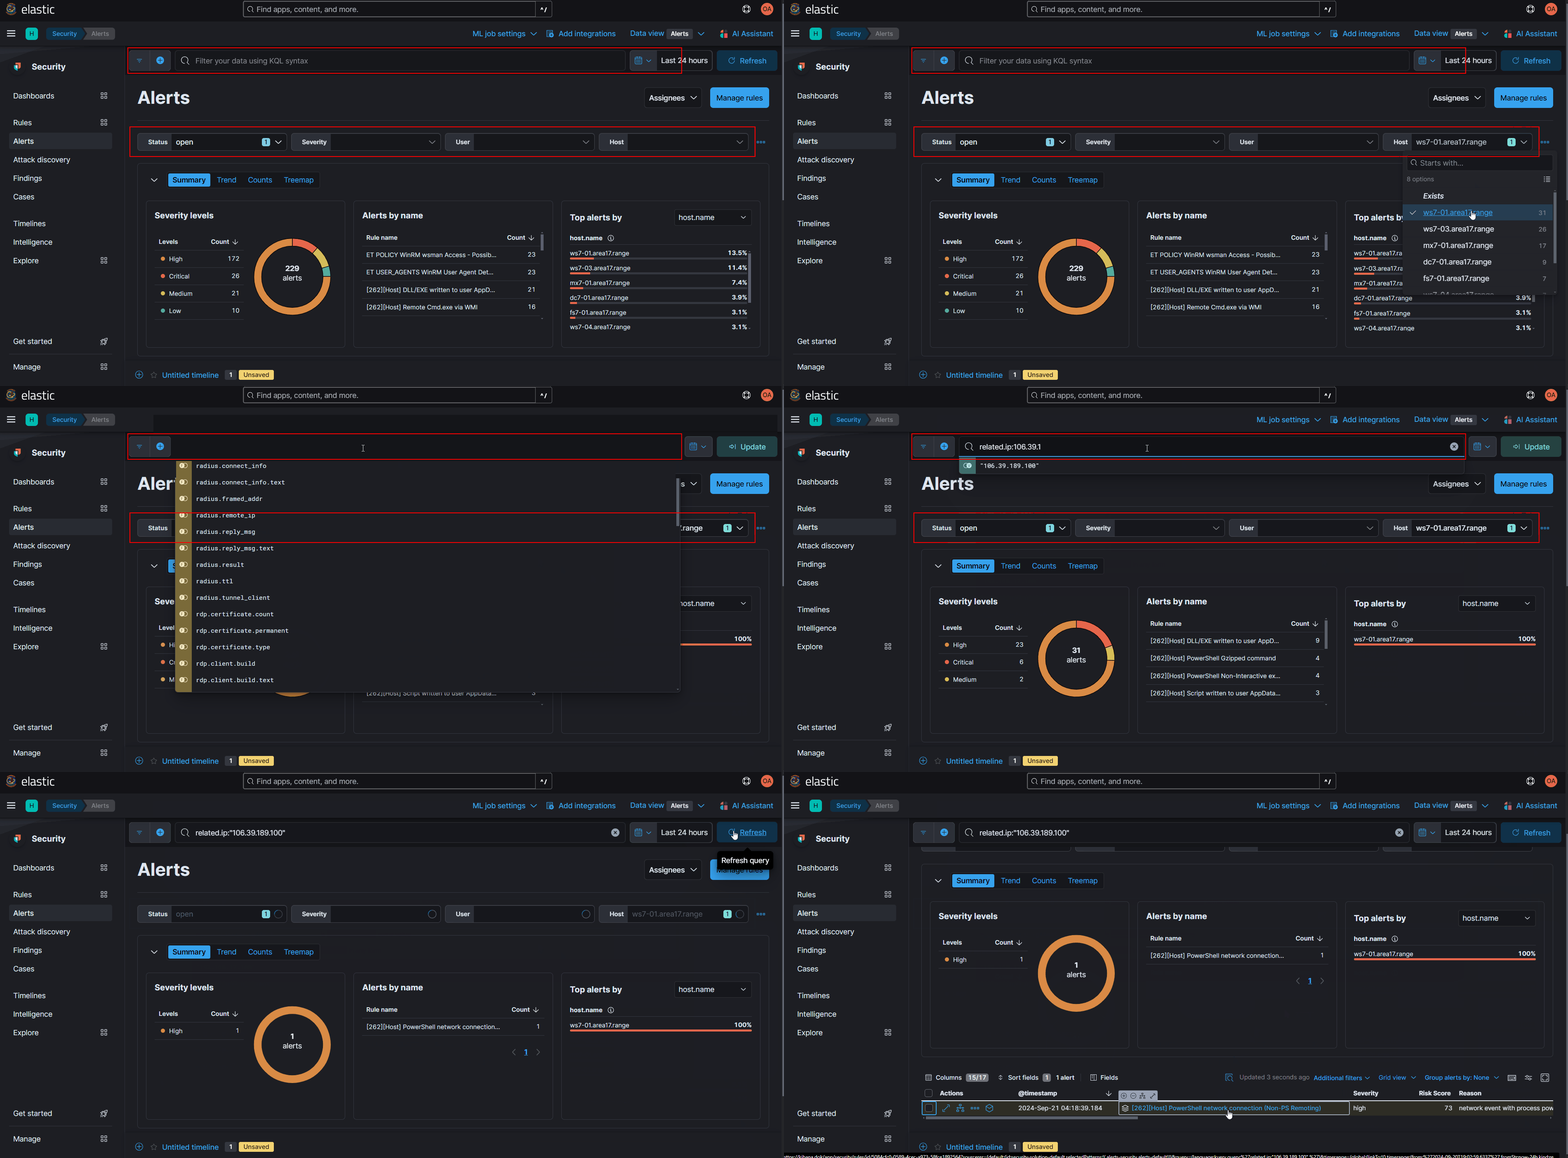
- Navigate to the Kibana (Security) Alerts console
- Optionally, enter a query or filter to narrow down to related alerts
NOTE: Within the Summary tab, you can also use the Top alerts by visualization to filter on a specific
user.name,host.name,source.ip, ordestination.ipvalue present within the alerts - At the bottom of the page, you will now only see the filtered alerts displayed
High Severity Alert
When to do this: Similarly to "Long Tail Analysis" of alerts, this is often performed when there is a large quantity of false-positive or low fidelity alerts. Logically, the highest severity alerts should command an analysts immediate attention, but be weary of that this is set by the rule author and the severity may not match the context of your environment.
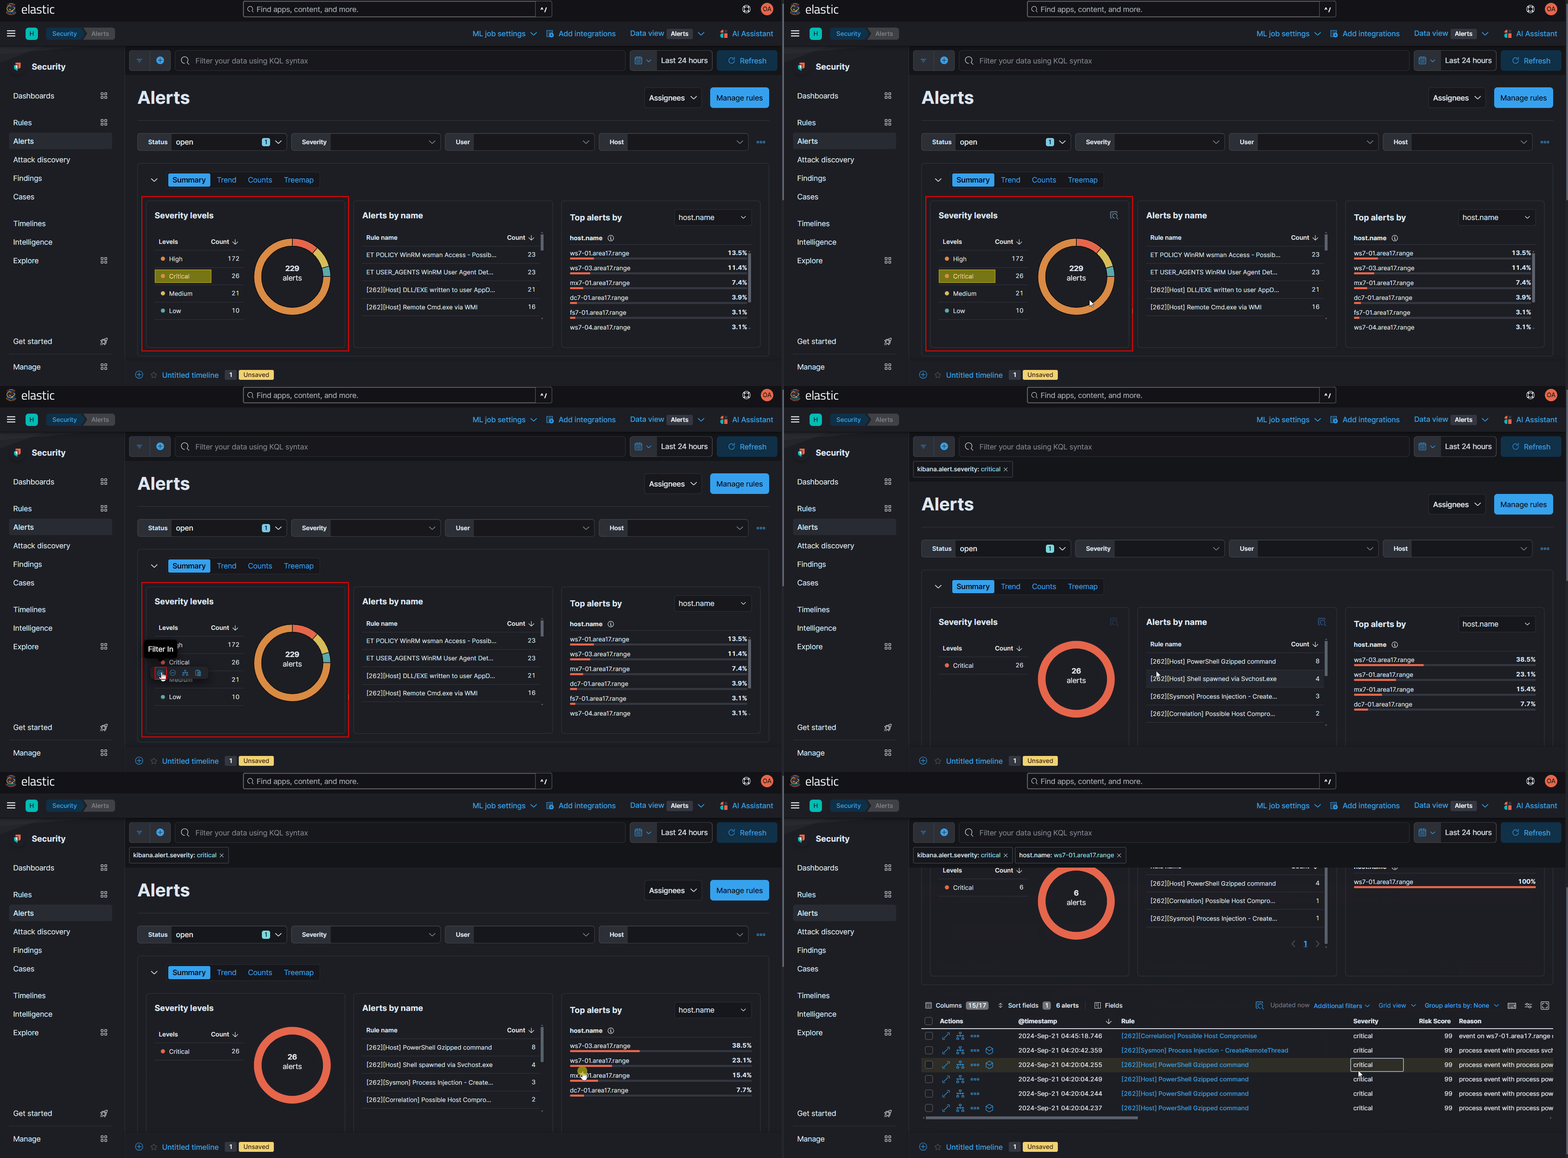
To filter for the highest severity alerts:
- Navigate to the Kibana (Security) Alerts console
- Ensure that the Summary tab selected so that you can see the Security levels, Alerts by name, and Top alerts by visualizations
- Navigate to the Severity levels visualization
- Hover over the highest severity level until the mini-toolbar appears - then click the ⊕ plus sign (
Filter In) - Within the Alerts by name visualization, analyze the rule names to filter for the most severe sounding alert
- Optionally, you can apply additional filters to further narrow down the alerts
- At the bottom of the page, you will now only see the filtered alerts displayed
Alert Tips
262COS/DOK Rule Naming Schema
| Label | Description |
|---|---|
[262COS] | All 262COS/DOK developed rules will begin with [262COS] in their title |
[ML] | Machine Learning rules will have [ML] in their title - the usefulness of these alerts vary wildly |
[Host] | Rules that trigger off of Sysmon, WinEvent, Auditbeat, Endgame, or Metasponse data will have [Host] in their title |
[EQL] | Endpoint Query Language rules will have [EQL] in their title - these trigger off of a sequence of events |
[Sysmon] | Rules that only trigger off of Sysmon data will have [Sysmon] in their title |
[WinEvt] | Rules that only trigger off of Windows Event log data will have [WinEvt] in their title |
[Zeek] | Rules that only trigger off of Zeek data will have [Zeek] in their title |
[Correlation] | Rules that trigger from correlating other alerts will have [Correlation] in their title |
[Status] | Rules that trigger from agent or sensor status events will have [Status] in their title |
Duplicate Alerts
262COS/DOK developed rules that trigger off of Sysmon, WinEvent, Auditbeat, Endgame, or Metasponse data will have [Host] in their title. Due to the multiple potential data sources, these rules are prone to triggering duplicate alerts if you have overlapping data - some built-in Elastic Security rules are also agnostic of their data source. For example, a process creation event will be logged by Sysmon, Windows Security Events, and Endgame - potentially causing 3 alerts for the same event. Be cognizant of this when triaging alerts.

TIP: When you observe duplicate process related alerts - it is best to select the alert with the
⬡(Analyze event) button (which is sourced from Sysmon) for analysis and close the others.