Overview Dashboard
[OVERVIEW] Summary
Description
Indexes: cvah-*
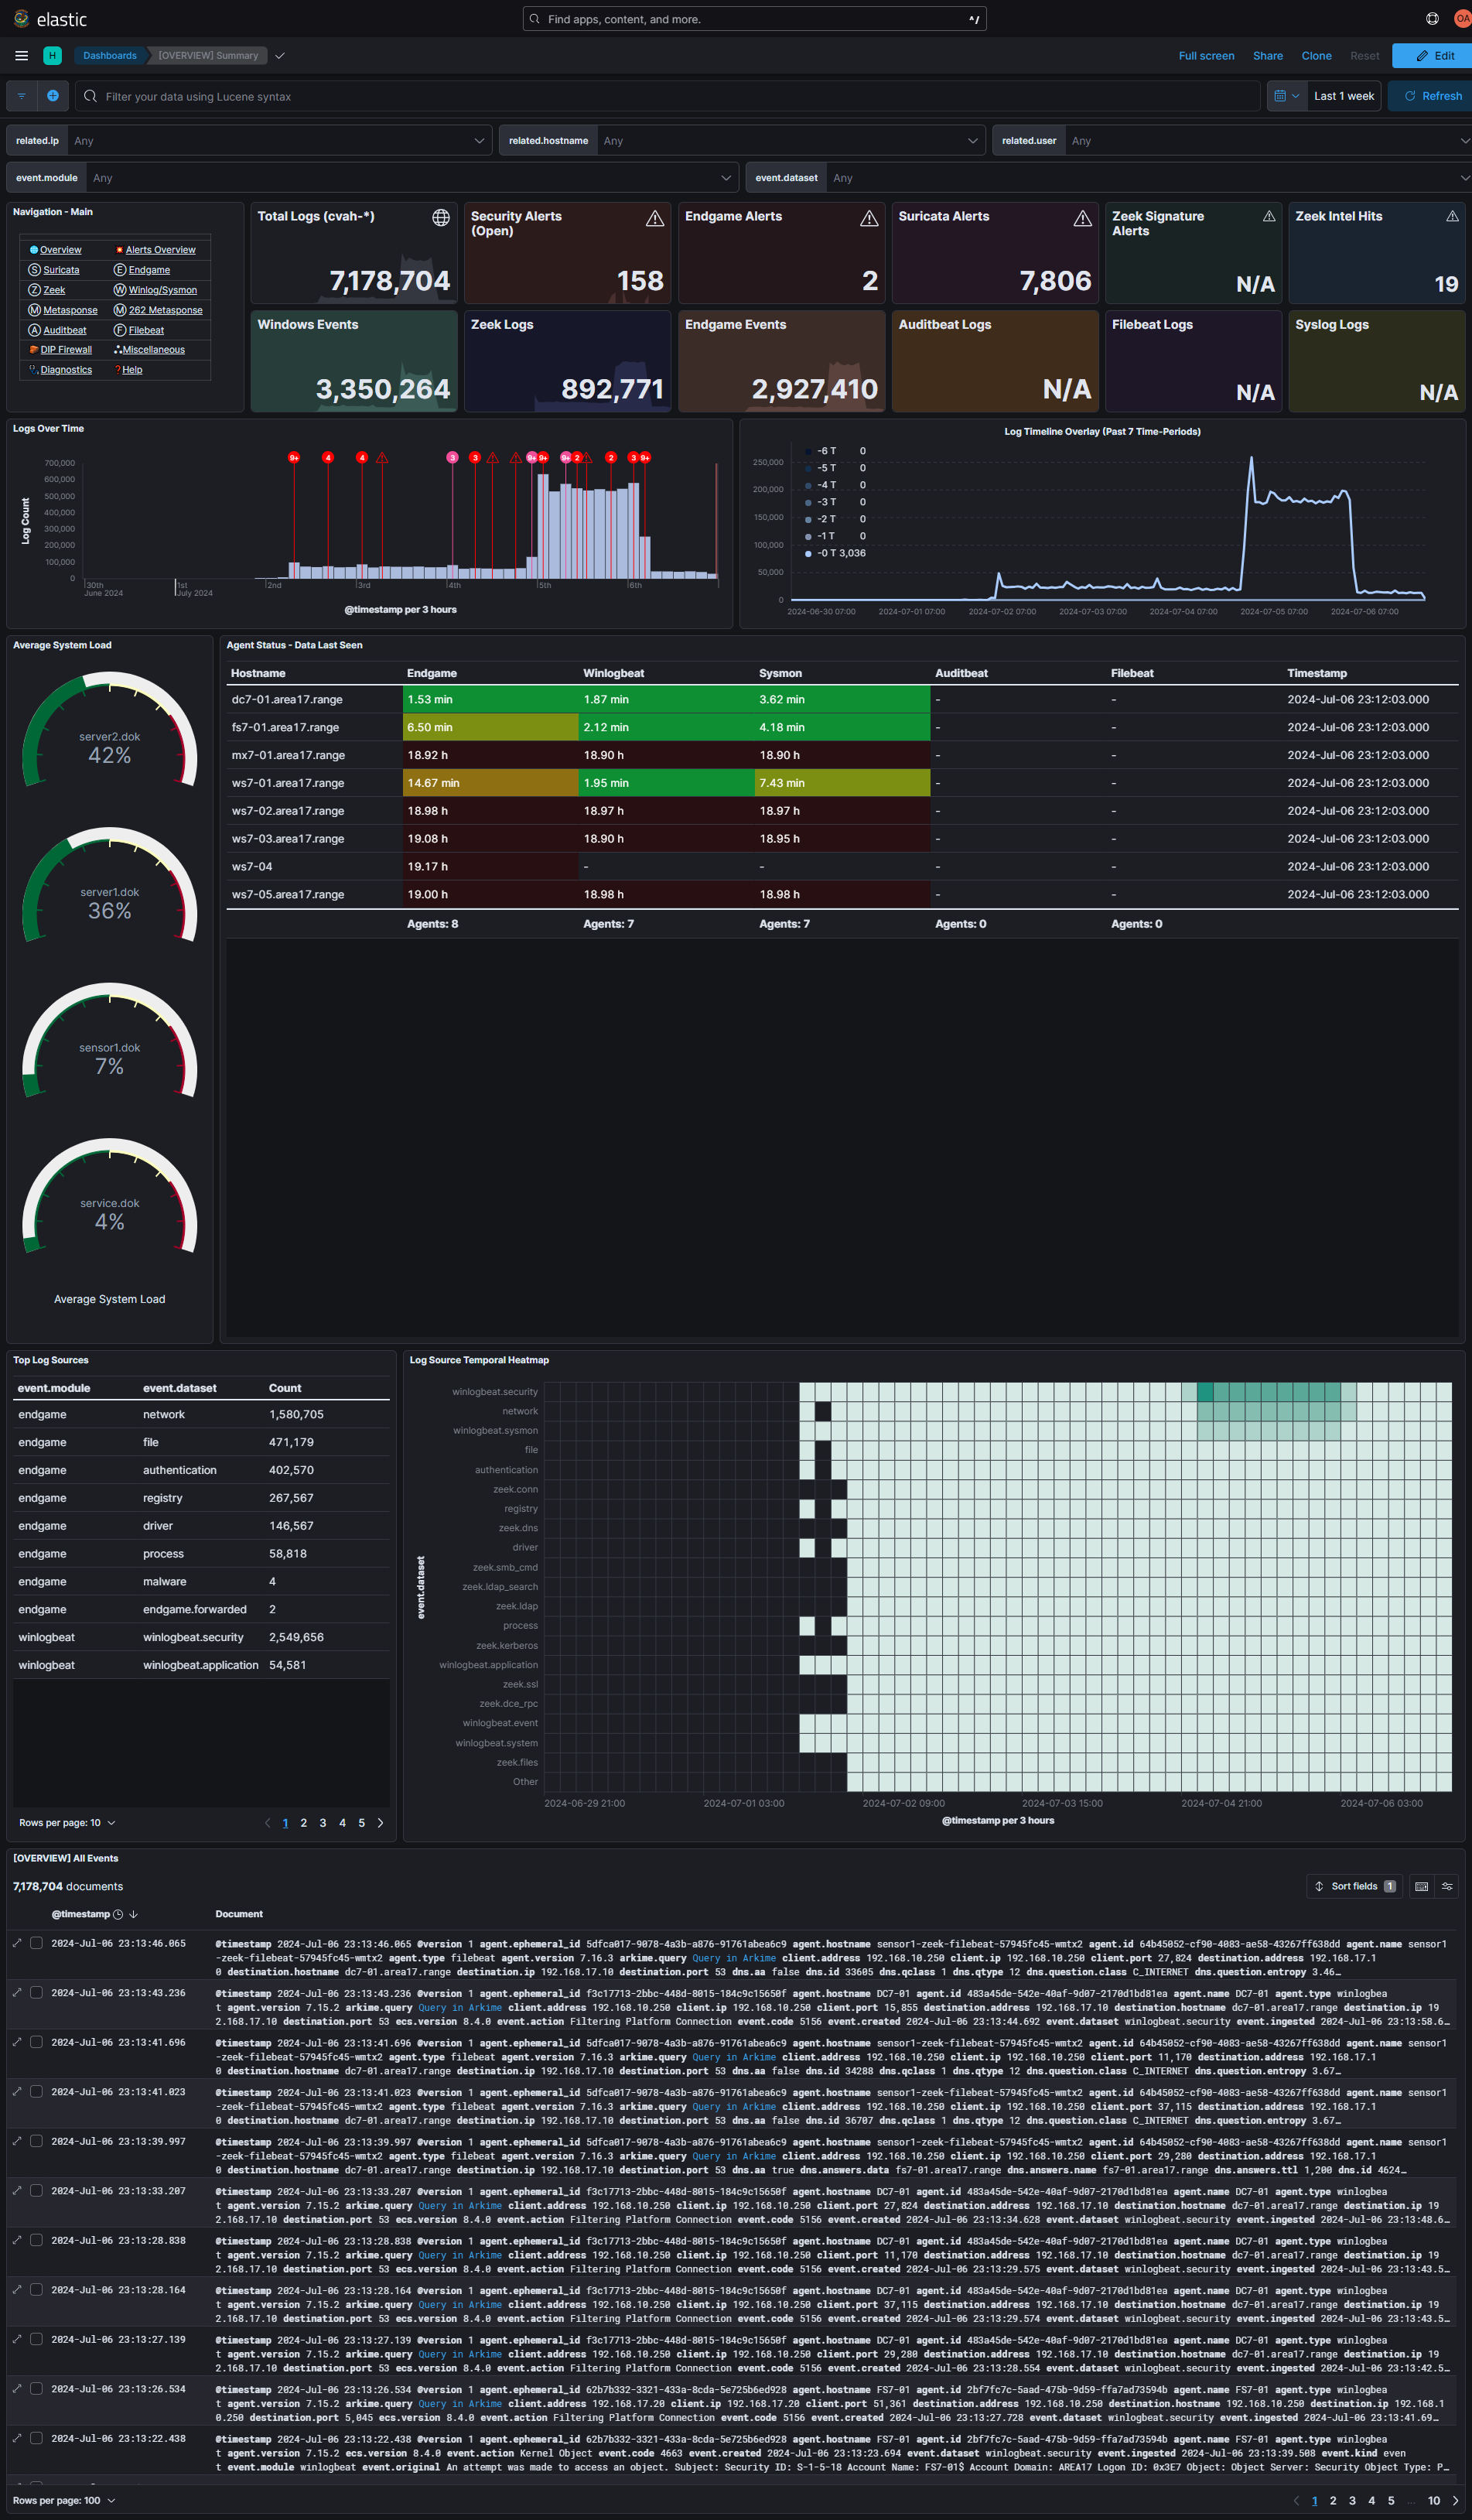
This is the default landing page when opening Kibana, or clicking on the Overview link in the main dashboard navigator. This dashboard is an overview of all logs within the custom cvah-* index pattern, with the exception of pfsense tagged syslog being forwarded from the DIP Firewall.
- Viewing the quantity of logs from different datasets collected over a period of time
- Viewing the average system "load" of all DIP Components with Metricbeat installed
- Viewing the "last seen" status of commonly deployed host agents
Notable Visualizations
-
Log Counts: Counter metrics for each major type of log or dataset within thecvah-*index pattern.
-
Agent Status - Data Last Seen: A table fueled by magic (an Ingest Pipeline, Transform, and a Cron job executing a bash script on the Controller every 3 minutes) that reports on the last time data was seen from a particular host agent on each host.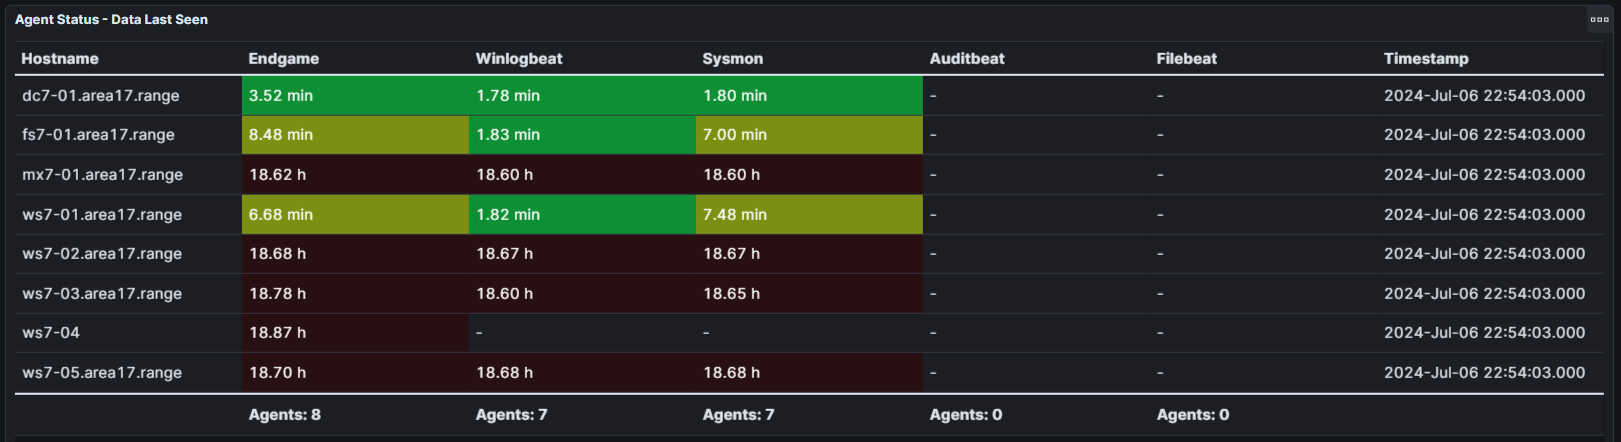
NOTE: An Elastic Detection Alert is automatically generated when data has not been seen from a particular agent in over 30 minutes.
-
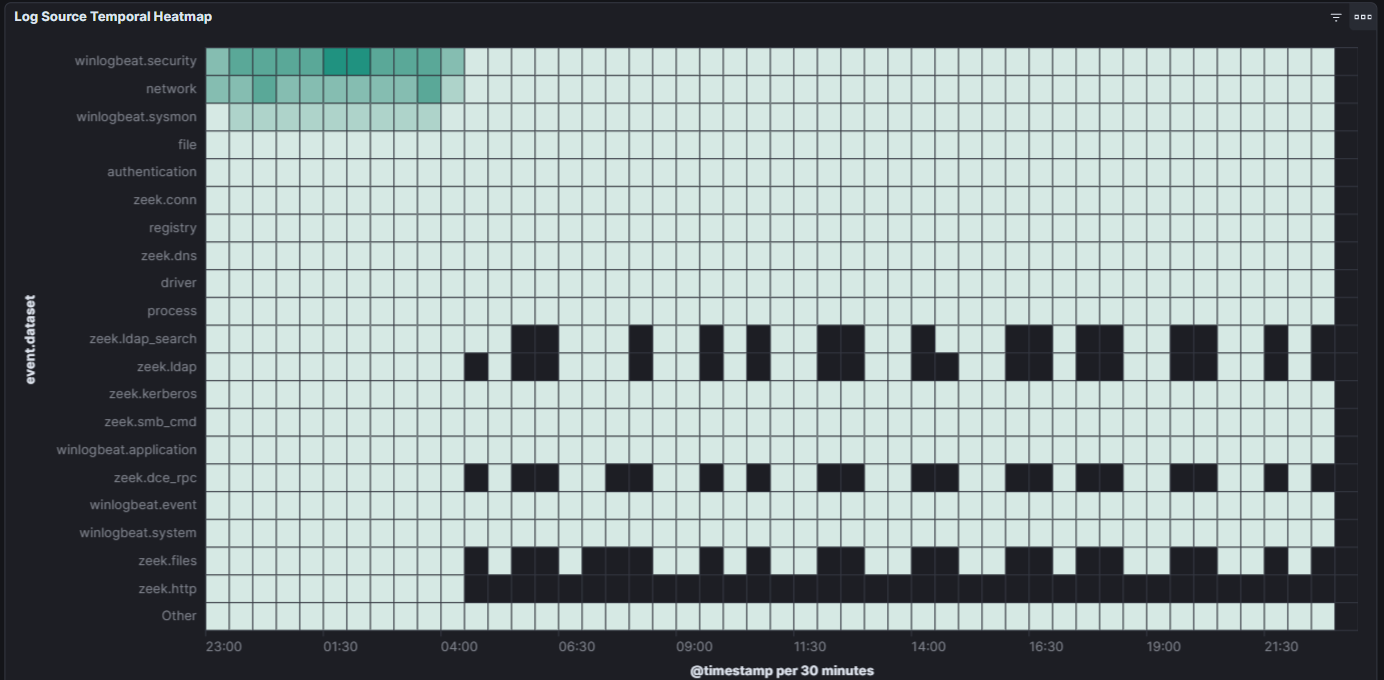
Log Source Temporal Heatmap: A table displaying the density of data over time from all of the differentevent.datasetvalues.